
Example 2 : Cached Stock pricing graph
This is an example of how to cache sophisticated images
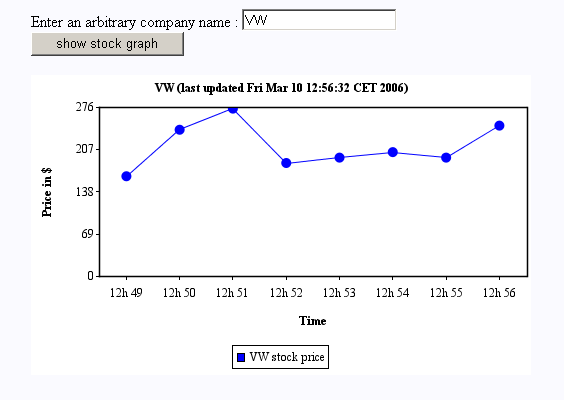
The free OOS library jCharts is used here to draw the graphs
- The user can enter an arbitrary company name and hit the 'show stock graph' button.
- The graph is cached application-wide with the key being the company name and the graph will expire 5 minutes after creation
- During the 5 minutes caching time, repeated calls from the same browser with the same company name will not arrive at the server, because the image is cached on the browser.
- See the jcharts with image maps example of how to add an image map to this same example >
Screenshot
Note
This is static documentation.
You can see this example live
Graph.html
<form jwcid="@Form">
	Enter an arbitrary company name : <input type="text" jwcid="@TextField"
	listener="listener:onSubmit" value="ognl:companyName"/>
	<input type="submit" value="show stock graph"/>
</form>

<img jwcid="@sotacs:DynamicImage"  parameters="ognl:companyName"
	height="300" width="500" painter="painter:paintGraph"
	cachingMode="literal:application"
	disabled="ognl:companyName == null || companyName.trim().length() == 0"
/>
Graph1.java
public abstract class Graph1 extends BasePage{

	private static final int MINUTES_BACK = 8;

	@Persist("client")
	public abstract String getCompanyName();

	/*
	* this method paints the graph and sets expiration time
	*/
	public void paintGraph(Graphics2D g2d, IPainterContext context){
		//retrieve data from DB
		double[] data = getStockData(getCompanyName());

		//render the chart with jCharts
		try{
			Chart chart = makeJChart(context, data);
			chart.setGraphics2D(g2d);
			chart.render();
		} catch(Throwable e){
			e.printStackTrace();
		}

		//set expiration time to 5 minutes
		context.setExpiresAt(System.currentTimeMillis() + 1000 * 60 * 5);
	}

	/*
	* Produce a chart using the jCharts-API
	*/
	private Chart makeJChart(IPainterContext context, double[] data)
				throws Exception{
		GregorianCalendar cal = new GregorianCalendar();

		String[] xLabels = new String[MINUTES_BACK];

		for (int i = MINUTES_BACK - 1; i >= 0 ;i--) {
			if(i != MINUTES_BACK - 1) cal.add(Calendar.MINUTE, -1);
			xLabels[i] = cal.get(Calendar.HOUR_OF_DAY) + "h " +
				cal.get(Calendar.MINUTE );
		}
		String xTitle = "Time";
		String yTitle = "Price in $";
		String title = getCompanyName() + " (last updated "+ new Date()+")";
		DataSeries dataSeries =
			new DataSeries( xLabels, xTitle, yTitle, title );
		String[] legendLabels = {getCompanyName() + " stock price"};
		Paint[] paints = new Paint[]{Color.BLUE};
		Stroke[] strokes= { new BasicStroke( 1.0f )};
		Shape[] shapes= { PointChartProperties.SHAPE_CIRCLE };
		LineChartProperties lineChartProperties =
			new LineChartProperties(strokes, shapes);
		AxisChartDataSet axisChartDataSet =
			new AxisChartDataSet(new double[][]{data}, legendLabels,
				paints, ChartType.LINE, lineChartProperties );
		dataSeries.addIAxisPlotDataSet( axisChartDataSet );
		ChartProperties chartProperties= new ChartProperties();

		AxisProperties axisProperties= new AxisProperties();
		LegendProperties legendProperties= new LegendProperties();

		return new AxisChart( dataSeries, chartProperties,
					axisProperties, legendProperties,
					context.getWidth(), context.getHeight());

	}

	/*
	 * retrieve stock prices out of a randomDB
	 */
	private double[] getStockData(String name) {
		Random random = new Random(System.currentTimeMillis());
		double[] data = new double[MINUTES_BACK];
		double start = random.nextDouble() * 1000.0 + 1.0;
		for (int i = 0; i < data.length; i++) {
			start += start * 0.4 * random.nextGaussian();
			if(start < 0)  start = - start;
			data[i] = start;
		}
		return data;
	}

}